Live · Interactive
Live data · Dublin, Ireland
Data Dashboard
A growing collection of widgets I've built and collated. The Irish Rail map, arXiv summaries, GOES X-ray plot and solar info are live widgets I developed from scratch, pulling from publicly available data via APIs I host. The weather and lunar widgets are lightly modified from free existing widgets. This board expands as I add new tools and projects.
Irish Rail · ~60s refresh
GOES X-ray · near-realtime
SDO AIA · −15 min
arXiv · daily
Transit
Selected route
Stops & Times
Click a train on the map to see its stops.
Solar activity
GOES · X-ray flux
3-Day Solar X-Ray
Ephemeris · Dublin
Solar Information
· UTC
.png) Sunrise
Sunrise.png) Sunset
Sunset.png) Solar Noon
Solar Noon Lunar Phase
 Day Length
NASA SDO · AIA / HMI
The Sun Now
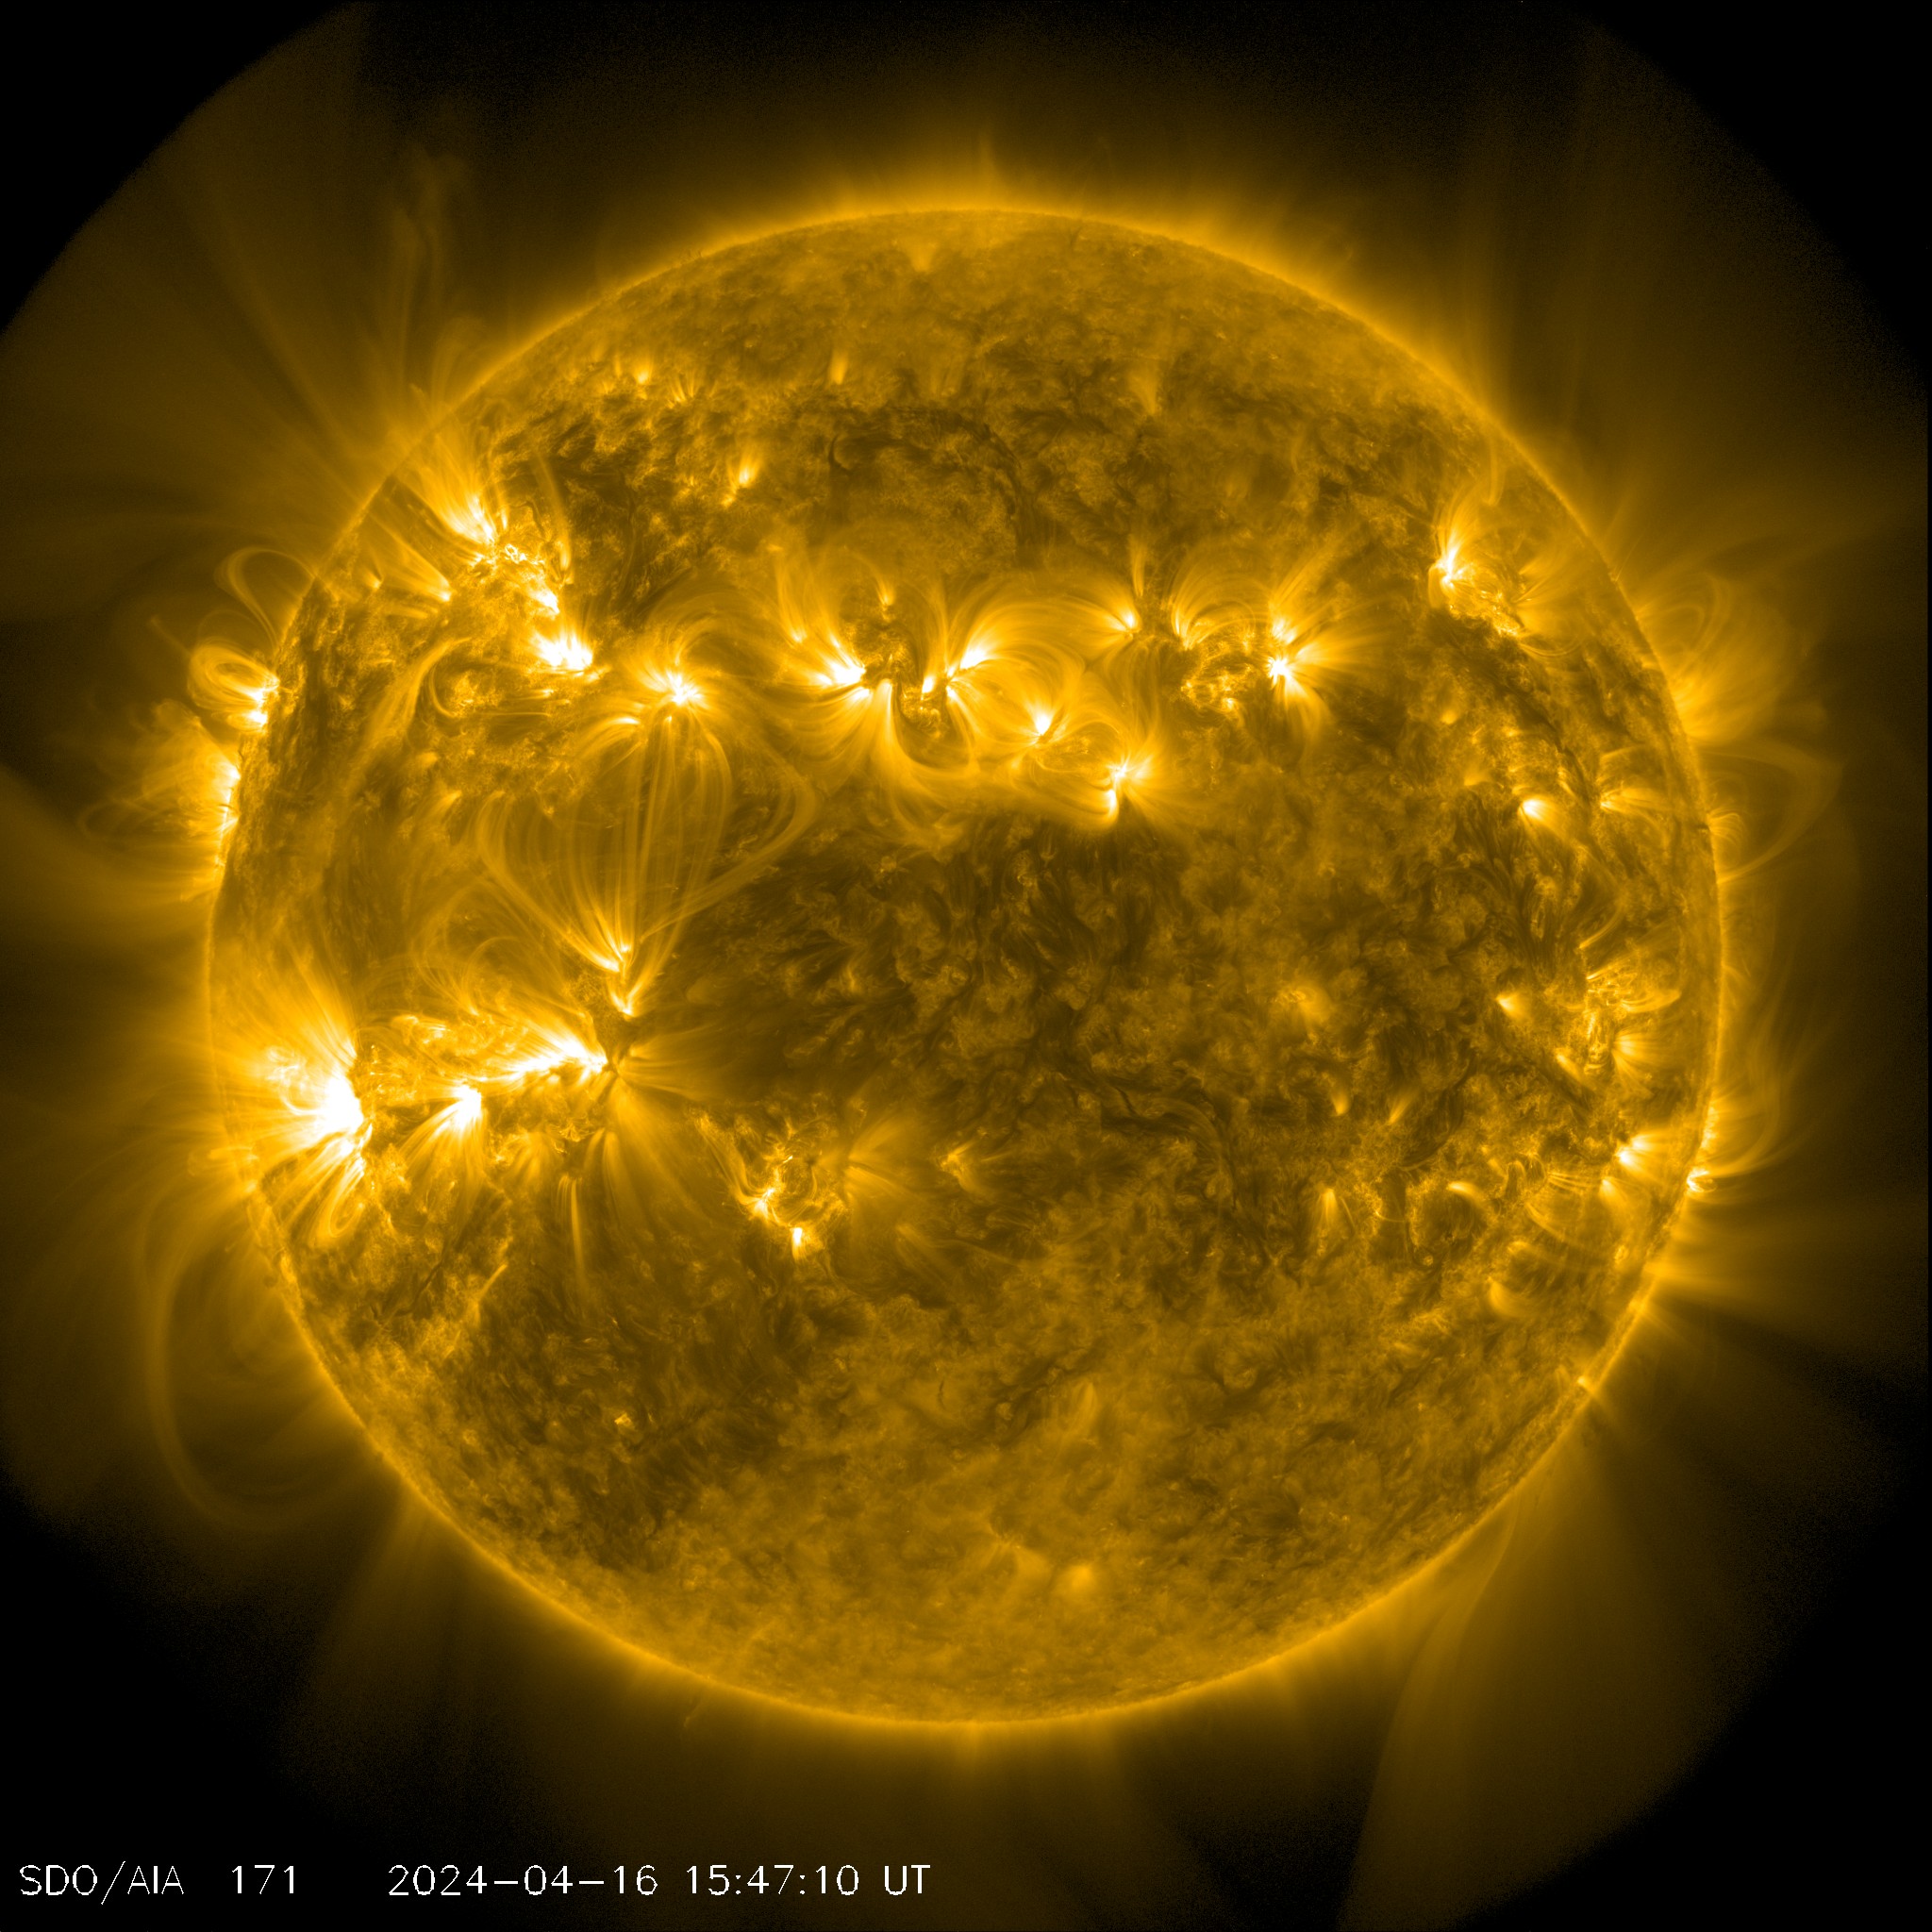
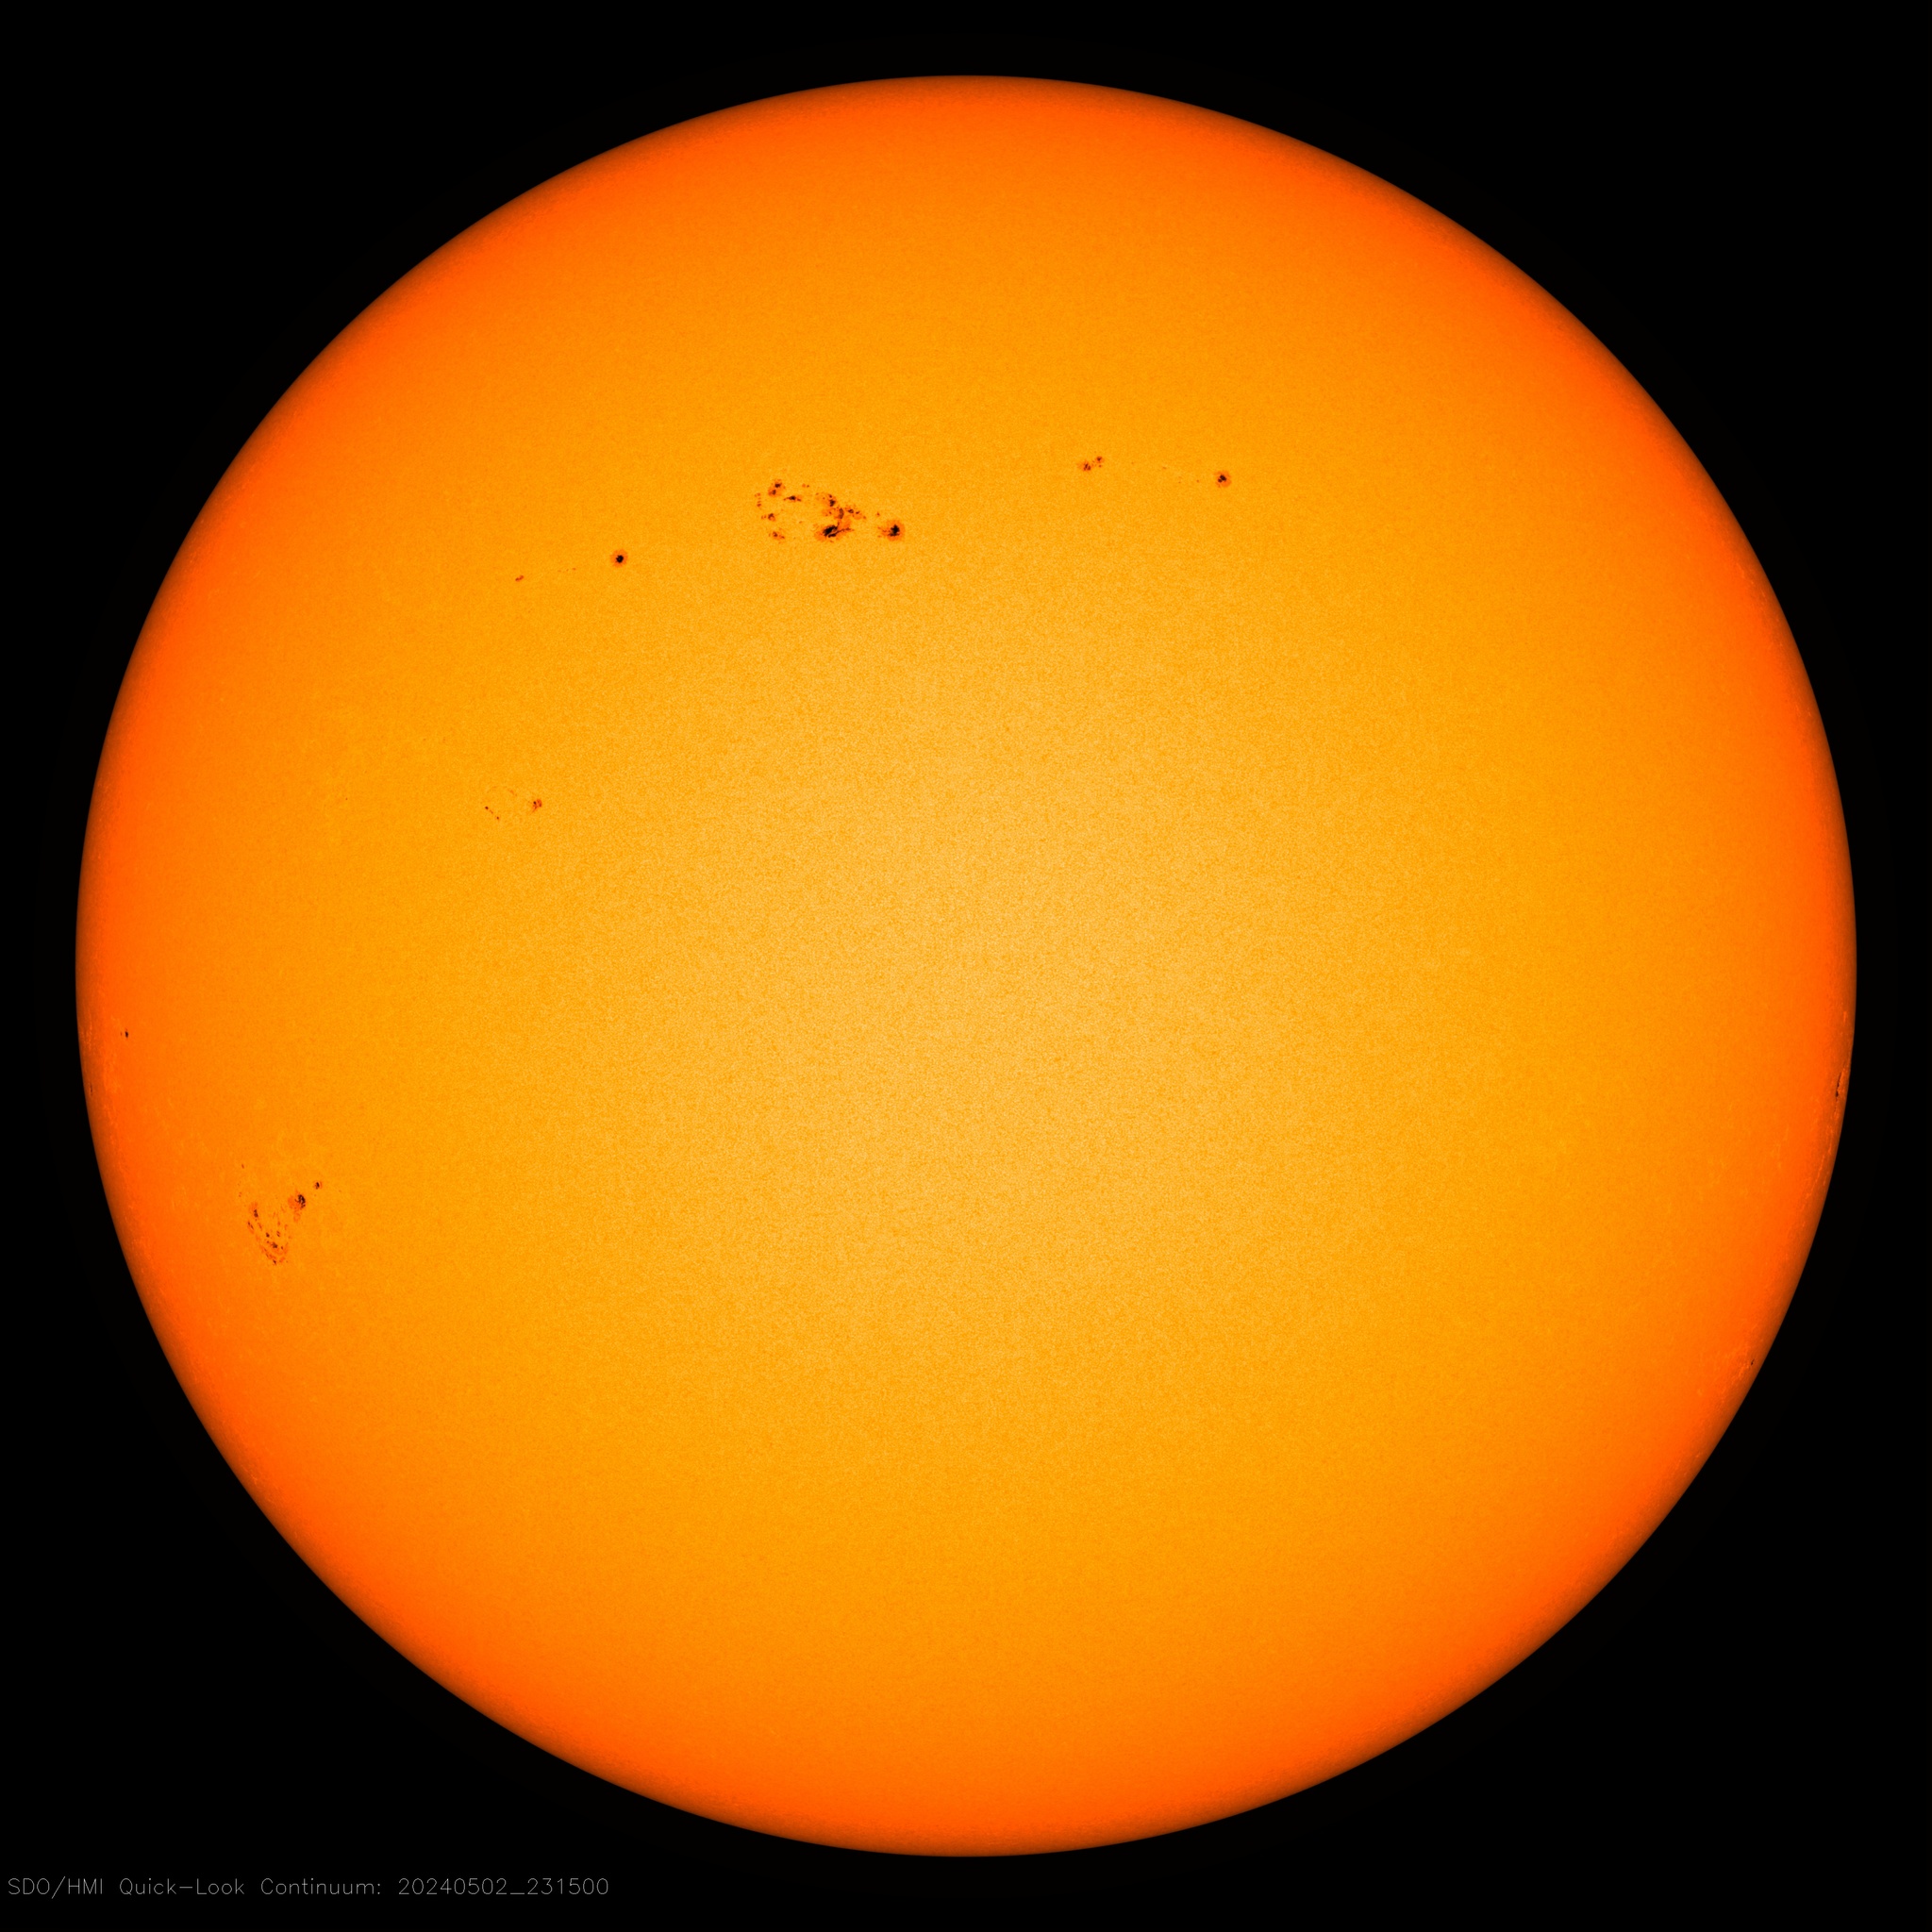
AIA 171 Å · HMI Continuum
icalendar37
Current Lunar Phase
Current Lunar Phase
.
.
Research feed
arXiv · flare stars
…
arXiv · flare stars
…
arXiv · flare stars
…
Paper metadata via the arXiv API (CC0). Thank you to arXiv for use of its open access interoperability.
Environment
weatherwidget.io
Dublin Weather
Code
Projects on GitHub
Source for these widgets and other experiments.
View profile →